Investigating the Nexus Between Investor Sentiment and Stock Returns Volatility in Nigeria
Asset pricing typically reflects the present value of future cash flows when the value is determined based on market fundamentals. However, investors are inherently parsimonious regarding everything related to their hard-earned money. An essential feature of financial assets for investors is the correlation between returns and volatility, which harmonizes the higher risk of investors with the higher expected returns (Chirila & Chirila, 2015).
Generally, investors expect certain returns on investment in stocks; however, stock prices fluctuate over time, contrary to investor expectations due to market volatility. Awalludin et al. (2018) define volatility as the degree of fluctuation in asset price, which can be high or low. According to Ihejirika and Anyanwu (2013), volatility, which can be historical or implied, is simply a measurement of risk (uncertainty) or fluctuation of a financial instrument's price over time. Volatility is the extent to which stock prices increase or decrease over time, with higher stock price volatility indicating higher investment risk. As such, volatility disrupts the orderly functioning of the stock market by reducing investor confidence due to uncertainties in stock return (Ndwiga & Muriu, 2016).
Moreover, high volatility discourages investors from holding stocks, as expected returns must be traded against risk exposure to the high-risk premium to optimize volatility risks (Ndwiga & Muriu, 2016). Furthermore, as a measure of a security's risk, volatility reflects a security's pricing behavior and helps estimate fluctuations that may occur over time. Hence, understanding the market participants' irrational sentiments is necessary for making sound investment decisions as it can significantly impact excess market volatility (PH & Rishad, 2020).
Concerning stock market investment, the investor's mindset about the market structure can be irrational. In other words, the investor may attach less importance to asset prices, returns, and market volatility. As a result, investors have frequently succumbed to externalities irrelevant to market fundamentals. This departure from market fundamentals explains why the unbiased process of determining asset prices under the Capital Asset Pricing Model (CAPM) was in doubt. CAPM presupposes an efficient and frictionless financial market and rational investors who are risk-averse.
Moreover, the CAPM has proven insufficient to explain the cross-sectional variations in expected stock return (Novak & Petr, 2011; Ward & Muller, 2012). Studies have also shown evidence of a direct link between investors’ attitudes and investor sentiment. According to Ogunmuyiwa (2010), investor sentiment plays a critical role in determining fluctuations in stock prices, stock turnover, and market capitalization. Consequently, investors’ behaviour in the stock market can lead to significant price fluctuations (Oprea & Brad, 2014). Therefore, investors' perceptions of the stock market significantly impact returns or stock prices and the stock market's growth.
Investor sentiment is a new financial concept that has changed perceptions about factors influencing asset valuation in capital markets (Alajekwu et al., 2017). According to the Classical hypothesis and the Efficient Market Hypothesis (EMH), investors exhibit a rational aversion to risk (PH & Rishad, 2020). Furthermore, they argued that the efficiency of the stock price information does not allow investors to outperform the market (Fama, 1965). Therefore, investors cannot earn abnormal returns because the information is already available in the market (Ur Rehman, 2013). However, with the growth of the financial market, behavioral finance has questioned and discarded the postulation of investors’ seamless rationality. Hence, the behavioral finance approach was considered a perfect alternative to the ancient classical hypothesis and the EMH.
Behavioral finance refers to the study focused on explaining psychology's influence on investors' decision-making process. It explains the emergence of irrational decision-making in the financial market when it should reflect rational decisions and an efficient market. Huang et al. (2014) identified investor sentiment as a critical factor affecting investors when making an investment decision. In other words, certain investors, called noise traders, are trading and making investment decisions in the financial market based on sentiment rather than sound fundamentals (Ur Rehman, 2013). These investor groups may be sufficiently large to prevent a firm's stock price from reflecting economic fundamentals. As such, the actions of these noise traders are mainly responsible for fluctuations in asset pricing and distortions in stock market returns.
Furthermore, the EMH failed to capture the presence of methodical mispricing in the stock market resulting from investor sentiment. It is evident that investors' irrationalities make them susceptible to sentimental waves in the market that affect their decision to invest in particular stocks (Anusakumar et al., 2017); such decisions cause the stock return to rise or fall. Whereas the variation in the asset prices relative to their fundamental values is generally due to the illogical behavior of the noise traders and arbitrageurs (PH & Rishad, 2020). It is evident that investors' irrationalities make them susceptible to sentimental waves in the market that affect their decision to invest in particular stocks (Anusakumar et al., 2017); such decisions cause the stock return to rise or fall.
Before delving into the different studies conducted on the interaction between investor sentiment, stock price, stock return, and volatility, it is vital to understand investor sentiment and why it has become increasingly relevant in recent years. Investor sentiment, or market sentiment, is a concept of finance that has changed perceptions of factors affecting asset pricing in capital markets. Investor sentiment reveals that the psychological perception of trading operations influences stock market trends. Traders are vulnerable to market sentiment – beliefs about future expectations and investment risks not backed up by evidence or statistical facts. When sentiment drives a firm's stock price, it diverges from its underlying value, putting investors at risk of overestimating or underestimating prices. Consequently, the attitude, reactions, and prejudices that emerge in an investment decision are called investor sentiment (Nnoje et al., 2021). Schmitz et al. (2006) define investor sentiment as investors' expectations about the price of one or more financial assets not based on fundamental information.
Furthermore, Baker and Wurgler (2006) described investor sentiment as a tendency to speculate about a particular asset's optimism or pessimism. According to Barker and Stein (2004), investor sentiment is a group of investors' understanding and misunderstanding of the market. In the opinion of Brown and Cliff (2005), investor sentiment represents the difference between rational and irrational investors. Consequently, the heterogeneity between investors is referred to as investor sentiment, which means that investors can rely on cognitive factors and their experience in making investment decisions. As such, investor sentiment refers to investment decisions based on biased asset prices and expectations rather than economic and market fundamentals (Alajekwu et al., 2017).
Previous empirical studies on investor sentiment and how to quantify it have raised the issue of whether it is possible to measure investor sentiment directly. As a result, some scholars examine investor sentiment from a normative standpoint. Baker and Wurgler's (2006) concept underlines the subjective character of investor sentiment as what asset prices should be rather than what they are. The empirical investigations revealed several studies conducted on the connection between investor sentiment and stock price, stock return, and market volatility (Baker & Wurgler, 2006; Brown & Cliff, 2005; Baker & Wurgler, 2007; Nnoje et al., 2021; Egbeonu & Isidore, 2016). However, there have been scanty studies on the influence of investor sentiment on stock return volatility in Nigeria.
Statement of Problem and Research Objectives
In recent years, the volatility of stock market returns has become a major concern for investors and researchers. Volatility, in this regard, is conceptualized as the natural phenomenon of a degree of information entropy. That is the uncertainty that embraces the factor of information asymmetry. Investors continually face the challenge of predicting stock prices because of the stock market's volatility, which has a negative or positive impact on stock returns over time. According to Engle (1982), investors are optimistic (pessimistic) about the positive (negative) movement in stock returns driven by past prices. As a result, investors risk losing all or a portion of their investments because the actual return may differ (Olasehinde–Williams, 2018). Investor optimism or pessimism connotes sentiment, and numerous studies have shown how it influences asset prices, returns, and volatility. Some studies have examined the relationship between sentiment-stock prices and sentiment-stock returns. However, investors are more interested in market volatility - the degree to which the price of stocks fluctuates relative to their average value. In Nigeria, there are few studies on the nexus between investor sentiment and stock return volatility.
Furthermore, some studies have estimated the influence of macroeconomic variables – inflation, exchange, and interest rates – on the volatility of stock market returns. Nevertheless, few of these studies examine how macroeconomic variables influence market volatility. This study fills this gap by determining whether the exchange, inflation, and interest rates are hidden variables controlling the influence of investors' market decisions on market volatility.
Therefore, the overall objective of this study is to investigate the nexus between investor sentiment, and the stock returns volatility of firms listed on the Nigerian stock exchange. This study aims to achieve the following goals:
- Investigate the impact of investor sentiment on stock return volatility.
- Examine whether macroeconomic variables control the influence of investor sentiment on stock return volatility.
- To determine if investor sentiment, macroeconomic variables, and stock return volatility Granger cause each other.
Significance of study
There is a scant study in Nigeria on the nexus between investor sentiment and stock return volatility. Previous studies have focused solely on estimating how investor sentiment influences stock returns. Even among these studies, the focus has been on the relationship between market volatility and expected returns on investments. However, during the high (low) sentiment period, investors tend to be irrational about the decision to secure their positions. In other words, investors are less (more) aggressive towards trading during low (high) sentiment because of their awareness of the miscalculation of potential risks that could arise from stock price movements.
Previous studies in Nigeria have yet to explore sentiment-return volatility in depth. Using Baker and Wurgler's (2006) market sentiment index, with the inflation, exchange, and interest rates as control variables, this study explores the stock returns volatility of listed firms in Nigeria. The study employs the E-GARCH model to contribute empirically to the existing literature. In addition, investors can also use the results to understand the volatility of stock returns before deciding to invest, thus enabling them to optimize their portfolios.
Research Hypotheses
The following hypotheses, based on the research questions and objectives, are tested in the course of the study:
- Investors’ sentiment has no significant relationship with the stock returns volatility of listed firms in Nigeria.
- Inflation, exchange, and interest rates have no significant relationship with the stock return volatility of listed firms in Nigeria.
- Investors’ sentiment, macroeconomic variables, and stock return volatility Granger cause each other
Literature Review
Various studies affirm the postulation of the Efficient Market Hypothesis (EMH), which states that investors are rational. Traditional theories focused primarily on market dynamics within the framework of EMH and random walk theory. However, the EMH and random walk theory overlooked the significance of investor sentiment since they failed to account for the diverse ways investors behave in the capital market. (PH & Rishad, 2020). However, like behavioral finance claims, investors are only occasionally rational. Some studies (PH & Rishad, 2020; Ángeles López-Cabarcos et al., 2020) have shown that investor sentiment strongly influences stock prices psychologically and sociologically. More recent studies have provided empirical evidence of investor sentiment's effect on stock market returns.
Brown and Cliff (2005) examined the relationship between investor sentiment and asset valuation. The study sought to validate behavioural model predictions that prices under react in the short run and over react in the long run. The study found a significantly positive coefficient on the sentiment variable, suggesting that the market is over-valued during periods of optimism. They observed that an overly optimistic (pessimistic) investor pushes prices above (below) fundamental values and that these pricing errors tend to revert over a multi-year horizon. As a result, if investor sentiment is high (low), future stock returns will be lower (higher). However, small firms are much less affected by sentiment, but large firms, especially over long periods, are much more influenced, resulting in greater predictive strength. A similar study by Baker and Wurgler (2006), using cross-sectional data on stock returns, looked at the impact of sentiment on returns. The results show a negative relationship between sentiment and stock returns in young, high-growth, unprofitable, volatile, and non-dividend-paying firms.
A recent study in Nigeria by Nnoje et al. (2021) reviewed the influence of investor sentiment, market dynamics, and stock market returns from 1985 to 2017. They used regression and Granger Causality to analyse the data, and the results showed a positive and significant relationship between stock returns and investor sentiment. Furthermore, Rupande et al. (2019), using South Africa as a case study, examined the nexus between investor sentiment and stock returns volatility from 2002 to 2018. The GARCH (Generalized Autoregressive Conditional Heteroscedasticity) model found a significant relationship between investor sentiment and stock returns volatility.
Using conventional regression and the Vector Autoregressive Model (VAR), Khan and Ahmad (2018) investigated investor sentiment and stock returns of Pakistanis. The VAR model showed a significant positive relationship between sentiment and stock returns. The findings suggest that emotion drives the stock market away from the sustainable path predicted by underlying market fundamentals. Consequently, without complete information, investors become irrational and rely on feeling, experience, intuition, emotion, or mood to determine stock prices. Likewise, Ahmed and Ullah (2012) found that market sentiment has a positive and statistically significant influence on returns. Concerning rates of return, the study found that investor mood had a significant positive influence.
Similarly, Oprea and Brad (2014) also investigated the relationship between investor sentiment (represented by the Consumer Confidence Index) on the Bucharest Stock Exchange from 2002 to 2011. They observed that individual investors' attitudes are strongly correlated with their sentiments, so their behaviour in the stock market can lead to significant changes in price fluctuations. The results showed a positive correlation between changes in consumer confidence and stock market returns, demonstrating that individual investor sentiment affects stock prices. However, this only happens in the short run, within one month, as the influence of individual investor sentiment appears to be quickly eliminated by the force of arbitration.
Lemmon and Portniaguina (2006) explored the time-series relationship between investor sentiment and the small stock premium using consumer confidence to measure investor optimism. The results showed a negative association between investor sentiment and stock market returns, even when mispricing appears to be addressed by noisy traders – investors. Furthermore, using data from the Chinese stock market, Changsheng and Yongfeng (2012) investigated the effects of investor sentiment on stock returns. The results showed that investor sentiment has an incremental explanatory ability for hot and value stocks. The results suggest that these stocks generate higher (lower) excess returns when investors are bullish (bearish). The study further revealed that stocks with low Book-to-Market and high price-earnings are sensitive to investor sentiment, which is considered too costly to arbitrage. The study thus sees investor sentiment as a significant systemic risk factor in asset pricing models.
Alajekwu et al. (2017) investigated the effect of investor sentiment on future returns in the Nigerian stock market. The results showed that the effect of investor sentiment on stock market returns was positive and significant. A unidirectional causality also ran from the change in investor sentiment to stock market returns. The study found a dynamic relationship between investor sentiment and the behaviour of future stock returns, with higher sentiment simultaneously driving stock prices higher. Similarly, Njogo and Mabinuori (2020) used a co-variance analysis to examine how investor sentiment affects trading stocks in different sectors in Nigeria. The results showed that investor sentiment exerts a significant positive impact on the stock trading of the firms investigated. The results suggest that investors are not always rational, and their irrational investment decision significantly influence the Nigerian stock market trade.
Yoshinaga and Castro Junior (2012) analysed the relationship between market sentiment and future stock returns. They used the principal component analysis to compute a sentiment index for the Brazilian market with data from 1999 to 2008. The results showed a negative and significant relationship between the market sentiment index and future returns. In addition, the results suggest a reversionary trend in stock returns, implying that after a period of positive sentiment, the impact on subsequent stock returns is negative and vice versa. Similarly, Chen and Haga (2021) discovered using the Shanghai Composite Index from 2015 to 2018 that the rate of return on stocks is more vulnerable to emotional sentiment than the stock price. They also found that retail investors tend to follow the crowd less in periods of pessimism than in optimism, which, in turn, can increase stock returns. Moreover, the rate of return before the market crash is lower than the rate of return after the market crash.
Using principal component analysis, GARCH, and Granger causality inference, PH and Rishad (2020) examined irrational investor sentiment's role in determining India's stock market volatility. The results showed that irrational sentiment is the source of excessive market volatility. Furthermore, the study showed that the asymmetric aspects of an inefficient market contribute to excess volatility and returns. Likewise, Uygur & Taş (2014) examined the effects of investor mood on several economic sectors using the Exponential Generalized Autoregressive Conditional Heteroscedasticity (E-GARCH) model. The results suggest that changes in investor sentiment have a more substantial impact on the conditional volatility of industrial, financial, and food and beverage indices than other sectors. In contrast, Gizelis and Chowdhury (2016) found that investor sentiment weakly explains returns, implying that behavioural factors can be factored into empirical asset pricing models for the Greek market.
Methodology
Data collection
The data collection for this study is from secondary sources: Nigeria Stock Exchange, Central Bank of Nigeria (CBN), Securities Exchange Commission, and National Bureau of Statistics covering the period between 2005 and 2020. Furthermore, the target variables are the market share prices of all firms, proxies for investor sentiment index, exchange rate, interest rate, and inflation rate. Table 1 below provides the details for these variables.

Construction of sentiment index
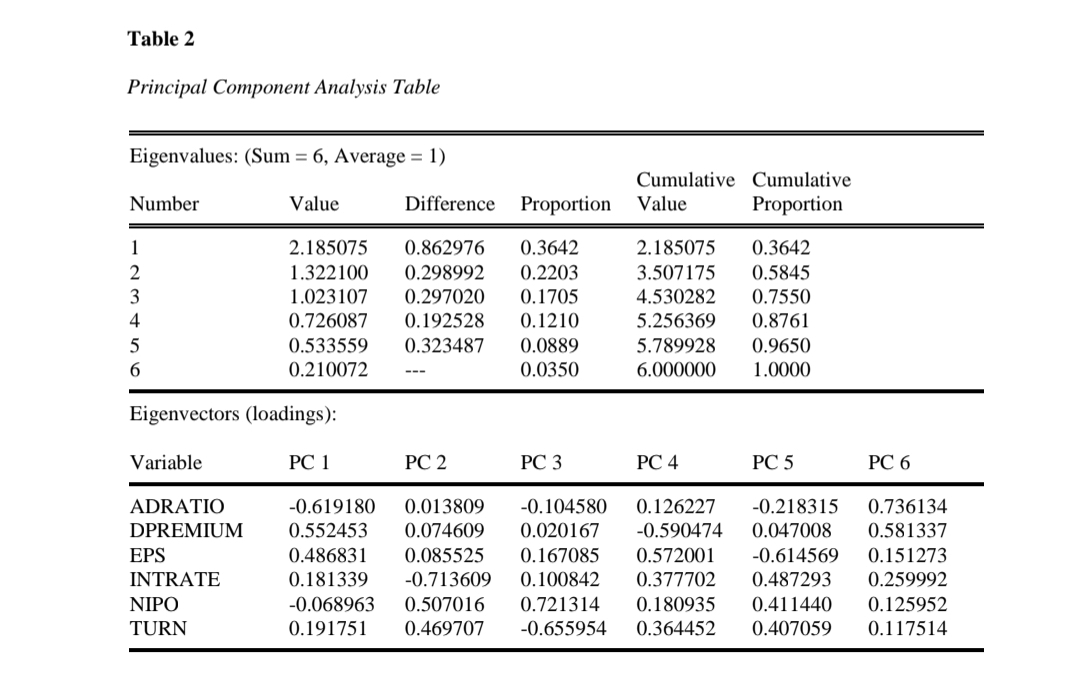
It is crucial to have a suitable proxy for the aggregate sentiment index to accomplish this study's objective. Njogo and Mabinuori (2020) used Nigeria's consumer confidence index (CCI) as a proxy for investor sentiment, while Nnoje et al. (2021) proxied investor sentiment by the turnover ratio. Some earlier studies (Rehman, 2013; Khan & Ahmad, 2018; Rupande et al., 2019; PH & Rishad, 2020; Chen & Haga, 2021) used different proxies for investor sentiment. Within the context of Baker and Wurgler (2006), six different proxies, based on data availability, were used to construct the aggregate sentiment index for this study. The variables are advance-decline ratio, dividend premium, earnings per share, inter-bank rate, number of initial public offerings, and turnover ratio. As a result, we carried out the Principal Component Analysis (PCA) to arrive at a unique aggregate sentiment index.
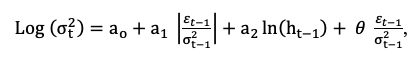
The PCA is a multivariate approach to analyzing numerous interrelated quantitative dependent variables that describe different observations. It seeks to identify the most relevant insights from data through data size compression and simplification without sacrificing critical information (Abdi & Williams, 2010). It consists of many phases to carry out linear transformations over a large number of correlated variables to generate a small number of independent elements. The primary goal of the PCA is to summarize indicator data as efficiently as possible using a common set of variables. Table 2 below reveals an analysis of the components of the six sentiment indicators, which comprise five main components. The first three components, with a cumulative proportion of 87.6%, were considered in forming the aggregate sentiment equation. The coefficient of the proxies (middle pane) loading is greater than absolute 0.5 is considered in forming the sentiment equation. Furthermore, the advance-decline ratio and the dividend premium are highly correlated (correlation equal 71%), meaning that the two variables measured the same thing, from which one of them, the advance-decline ratio, was removed. Thus, the final sentiment equation is:
![]()

Exploratory Data Analysis
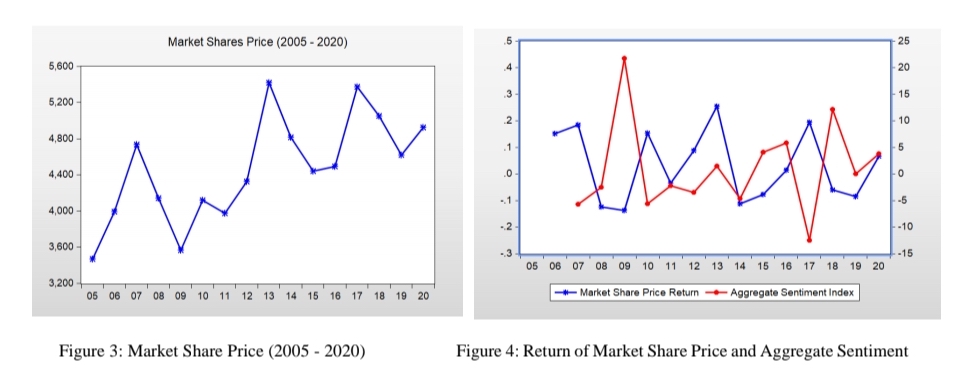
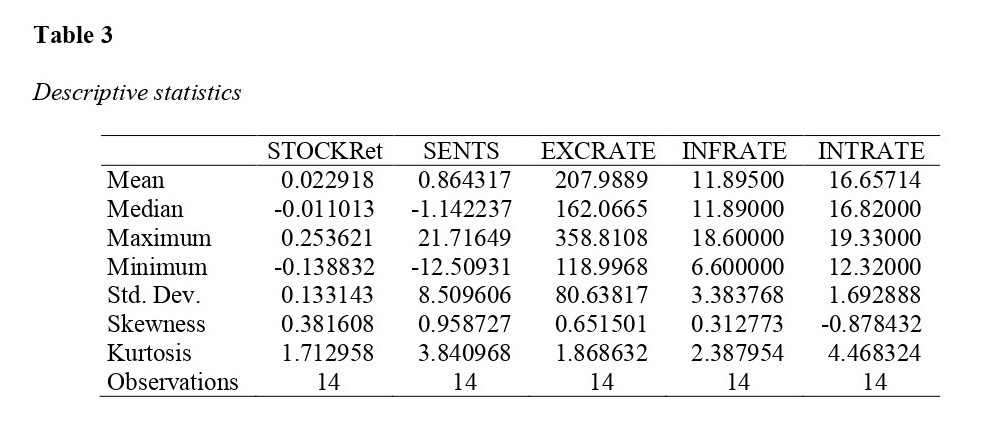
Before running the model, we performed an exploratory data analysis (EDA) to assess the underlying factors influencing the analysis. The EDA was performed using a time series plot of market share price (Figure 1), a time series plot of return of share price and aggregate sentiment index (Figure 2), descriptive statistics (Table 3), and correlation matrix (Table 4).
Unit Roots
It is necessary to guarantee the stationarity of the variables for accurate parameter estimation. We used the augmented Dickey-Fuller (ADF) to test the variables' stationarity. The ADF test has the null hypothesis that the original series of the variable has a unit root, i.e., not stationary, and the rejection/acceptance of the null hypothesis depends on the asymptomatic chi-square statistic with a 0.05 significance level. If the series has a unit root, it must be differenced before using them in the model estimation. The ADF test result is as shown in the analysis and result section.
Measures of Stock Market Volatility
Different studies have used different methods of modeling the influence of uncertainty, or market volatility, on investor sentiment. These include the traditional measurement - the simple standard deviations or variance; time series conditional heteroscedastic methods for time-variant volatile measures; and entropy - the new measurement for time-invariant volatile measures (Bentes & Menezes, 2012). For the time-variant measurement, Engle's (1982) autoregressive conditional heteroscedasticity (ARCH) method, later developed to include a lagged dependent variable in the conditional variance (GARCH), has been used to capture volatility in numerous studies. The GARCH method, as stated by Bollerslev (1986), captures greater risk, in each period, than the traditional measurement. In view of this, we used the GARCH method to derive the stock volatility used in this study.
Model specification
To estimate the effect of investor sentiment and stock returns volatility, more than traditional regression analysis - ordinary least square (OLS) estimation is needed to bring out a robust estimation. The OLS requires that the residuals be independent and normally distributed and that the homoscedasticity of variance is maintained. However, financial time series data usually have unstable means and variances. This is so because the time series stages usually go with severe instabilities or random fluctuations, and the stock return volatility typically has autoregressive conditional heteroscedasticity (ARCH) effect (West, 1987). As a result, Bollerslev (1986) developed a generalized ARCH (GARCH), which captures stock volatility and dependent conditional variance on past lags. However, the study by Chen and Haga (2021) found that GARCH is limited to estimating only the positive response function and symmetrical negative financial shocks. In addition, positive financial shock tends to be weaker than negative financial shocks in a typical financial time series. Daniel (1996) has extended the GARCH model to a more common model of which E-GARCH, used in this study, is one of them.
E-GARCH model
Adopting the model from the research of Uygur & Taş (2014) and Chen and Haga (2021), this study employed the Exponential-GARCH (E-GARCH) model to determine the impact of investor sentiment on the stock returns volatility of listed firms in Nigeria. Unlike the GARCH model, the E-GARCH model solves the asymmetry constraints of positive and negative shocks on the market returns and corrects the constraints that the parameter estimates must be positive as in the GARCH model (Daniel, 1996). Moreover, E-GARCH (1,1) model employed a logarithmic model of conditional variance, which can either be positive or negative, thus overcoming the GARCH constraints of only positive coefficients of the predictors. As a result, this study used the EGARCH (1,1) model. The model expression between the stock returns volatility (STOCKRet) and the explanatory variables (sentiment index, exchange rate, and inflation rate) is given in Equation 2 below:
![]()
[2]
where STOCKRett is the stock return volatility, Xt is the vector of explanatory variables, ßi coefficient of explanatory variables, is the constant.
Also, ![]() zero mean with white noise sequence
zero mean with white noise sequence
ao is the residual sequence, a1 is the
coefficient of ARCH effect, a2 is the coefficient of GARCH effect, Ø is coefficient of asymmetric effect. If less than 0, then it means the effects of negative shocks on the stock return volatility is more than the effect of the positive shocks. In particular, the impact of the shocks is asymmetry is Ø ≠ O .
Diagnostic test
To affirm that E-GARCH is the right model for this study, ARCH effect test was used. It has a null hypothesis that the lags of residuals are not significantly different from zero and the test is based on asymptomatic chi-square value. The expected result here is that the null hypothesis should be upheld.
Analysis and Result
Exploratory Data Analysis: Time series plot
The closing stock price index (Figure 1) shows a peak movement from 2005 to 2007, dropping from 2008 – 2009 before rising until 2014, when it dropped again. The time series plot depicted no actual trend movement in the market share price index from 2005 – 2020. Figure 2, which contains the series plot of the share price’s return and aggregate sentiment index, shows that both the share price’s return and sentiment index is full of positive and negative movement throughout the years considered. The dynamic movement revealed that the series would need to be tested for unit roots, and it has a meaningful impact on the methodology to be used in the study.
Descriptive Statistics
Unveiled in Table 3 are the descriptive statistics of the variables. The average stock price return is 0.023 with a standard deviation of 0.139, greater than the mean, showing a high level of dispersion and uncertainty. At the same time, investor sentiment has an average of 0.864 and a deviation of 8.510, which also reveals a high level of disparity in the investors’ behaviour in Nigeria. The exchange rate has a mean of 207.99 and a standard deviation of 80.64, which is lower than the mean, indicating a low variation. The inflation rate has an average of 11.90% and a standard deviation of 3.38%, also explaining the low variation from 2005 to 2020. Moreover, the interest rate for the target period has an average of 16.65% and a standard deviation of 1.69%, explaining the minimum dispersion of each interest rate relative to the mean.
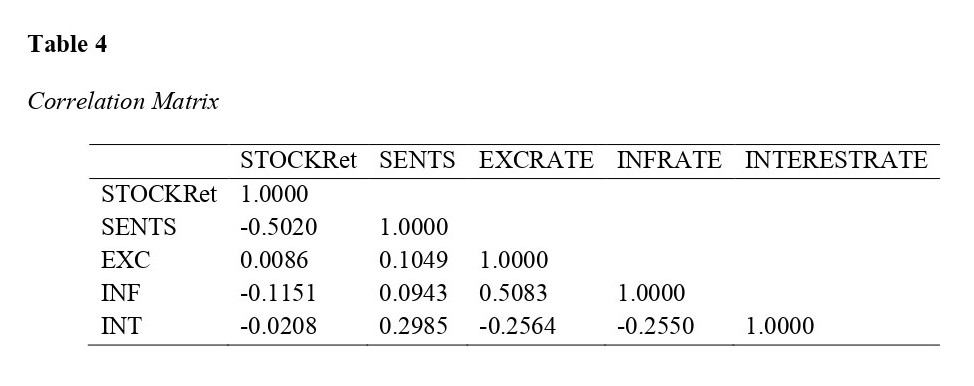
Correlation matrix
Table 4 shows the correlation matrix among the studied variables. It shows that the extent of association between the stock return and investors’ sentiment is averagely negative (SENTS = -0.50); stock return also has a weak positive correlation with the exchange rate (EXC = 0.01) and a relative negative correlation relationship with the inflation rate (INF = -0.11), and with the interest rate as well (INT = -0.02). The result indicates that investors have a decreased stock return rate as the inflation and interest rates increase. Furthermore, a cursory look at the table reveals that no predictor is highly correlated with one another, meaning that the problem of multicollinearity of the predictor variables is avoided; hence all the predictors are well fit to be combined in the equation.
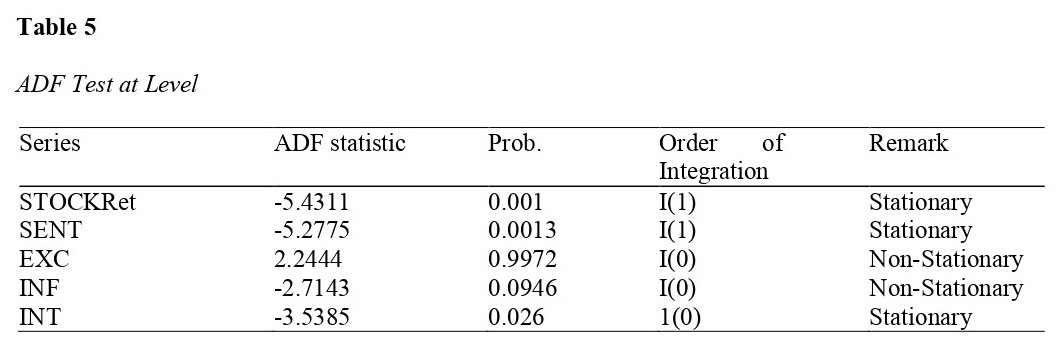
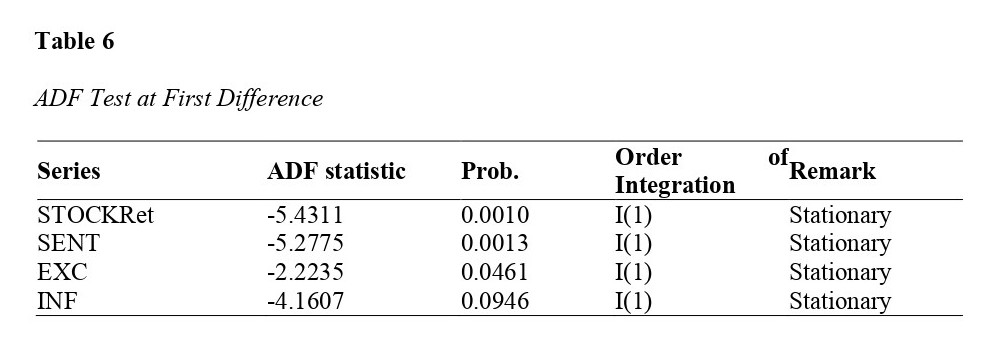
Unit root test
Tables 5 and 6 present the results from the unit root analysis using the ADF test. Table 5 contains the unit roots of the original series at level, and the results show that only stock returns and sentiment index are stationary or have no unit root (p<.001). At the same time, the exchange and inflation rates are not stationary. The reasons for stock returns and sentiment index stationarity are that the two variables were already computed from the original data and are already at lag one. In Table 6, the ADF test reveals that all the variables are stationary at the first difference, although the inflation rate is slightly less than the 5% significance level.
Source: Author’s computation from Eviews 15
Source: Author’s computation from Eviews 15
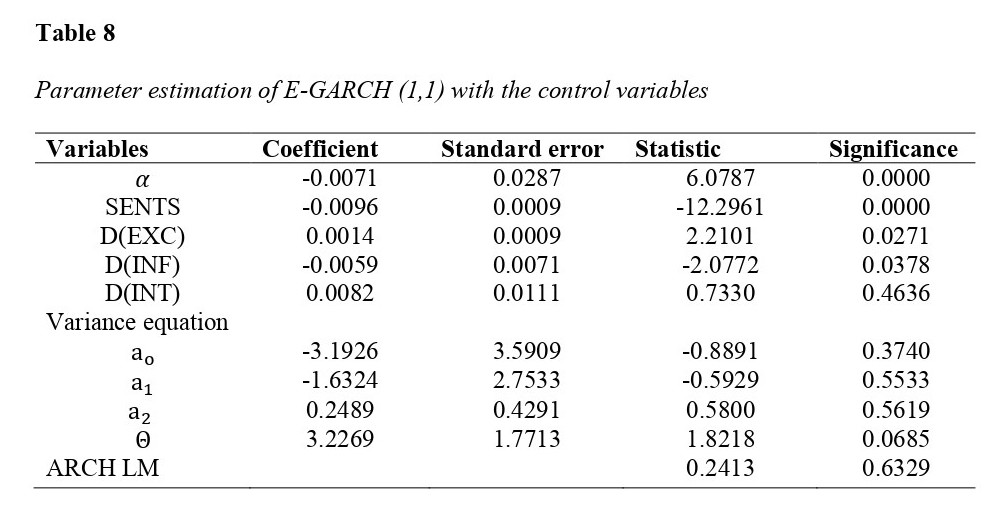
E-GARCH model evaluation and Discussion
Table 7 - Investor Sentiment and Stock Return Nexus - displays the estimated E-GARCH (1,1) results. Table 8 also presents the result of investor sentiment and stock return nexus while controlling for the effect of the exchange rate and inflation rate. Generally, common observations from both tables show that the E-GARCH (1,1) is perfectly fitting because the hypothesis that the residual sequence is white noise is upheld. The second is the coefficient of the ARCH (a1) and GARCH (a2), whose significant values exceed 5%. The result shows that the ARCH and GARCH effect is well captured in the model, thereby revealing a negative leverage effect and high persistence of volatility in the market return. The third one is the coefficient of asymmetric effect, which is above zero and thus explains that the effects of positive sentiment, between 2005 and 2020, on the stock return volatility are greater than the impacts of the negative sentiment. We expect this outcome because, according to De Long et al. (1990), the higher sentiment of noise traders increases the market price volatility.
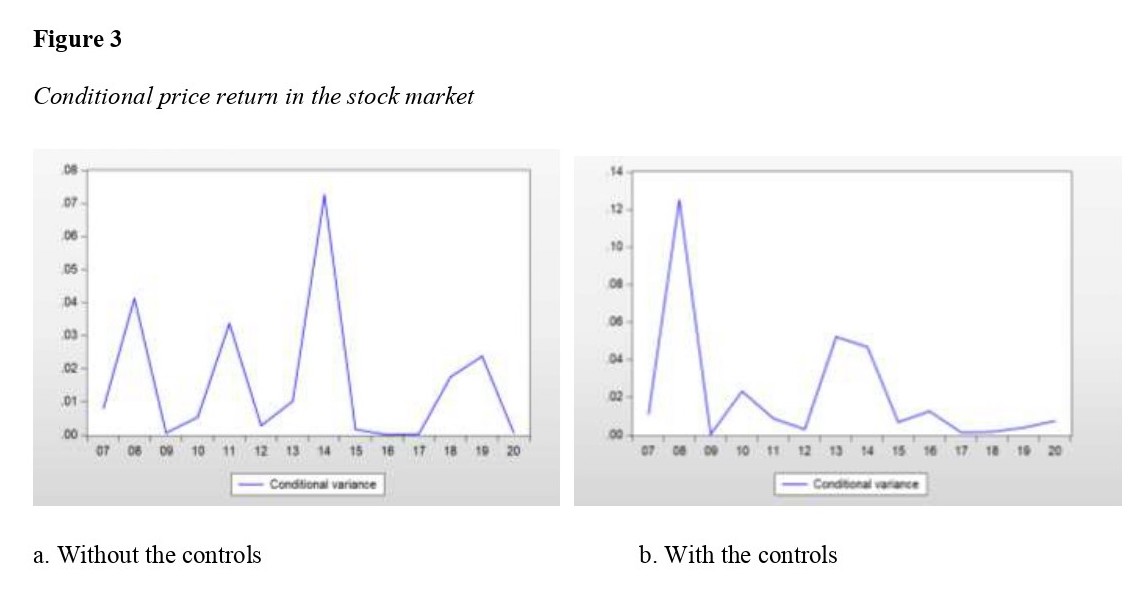
Moreover, the coefficient of the sentiment index on stock return volatility is negative and significant in both cases (p<.001), indicating that the relationship between sentiment index and stock return volatility is inverse. The outcome contradicts the findings of Nnoje et al. (2021), which support that investor sentiment is positively related to stock return for 1985 – 2017. However, it supports the findings of Baker and Wurgler (2006), Miller (1977), and De Long et al. (1990). Also, the positive and significant relationship between the exchange rate and stock return volatility (p<.05), as depicted in Table 8, implies that stock market returns volatility increases when the exchange rate decreases. This is expected because if the exchange rate increases against the foreign currencies, the value of the naira falls, making the market more volatile from the point of view of foreign portfolio investors, and the domestic investor becomes pessimistic about a possible bearish market. As for the inflation rate, its effect on the stock return volatility is negative and significant (p<.05). This means that if the inflation rate in the country is high, the stock return rate reduces. Although interest rate has a positive relationship with investor sentiment, the impact is insignificant (p>.05). This means that interest rate and investors’ mood are not significantly related. When diagnosing the model through the ARCH LM test of the conditional variance, the significant value of the ARCH LM test (p>.05) shows that conditional variance (Figures 3a and 3b) the variables are not statistically different from zero. Thus, the heteroscedasticity of variances is well controlled. Furthermore, the Granger causality model (Table 8) shows a one-directional relationship between stock return and sentiment index, from stock return to exchange rate and from inflation rate to exchange rate. On the other hand, there is no evidence of causality between exchange rate and return price (p>.05), inflation rate and return price (p>.05), interest rate and return price (p>.05), sentiment index and interest rate (p>.05), sentiment index and exchange rate (p>.05), and sentiment index and interest rate (p>.05).

Source: Author’s computation from Eviews 15
Source: Author’s computation from Eviews 15
The Granger causality result is more explicit and gives the full direction of the causality. From the analysis, it is clear that there is uni-directional causality in the variable running from one to another without feedback. This is shown in Table 9, where there is significant movement of the causality from RETPRICE to SENTS and RETPRICE to EXCRATE). These two strands show the implication of the returns excitation by investors. The foreign portfolio investor is also significantly impacted apart from the domestic investor. Expectedly NFRATE Granger causes EXCRATE, even in normal international economics. Other results are in tandem with the expectation and are significant. INTERESTRATE Granger causes EXCRATE, INTERESTRATE Granger Causes EXCRATE, and D(INFRATE) does not Granger Causes INTERESTRATE. With the results, the flows and tide of the investors' sentiment can be managed, and the opportunities that create investors' expectations can be fully monitored. The results indicate that the investors simply react to the macroeconomics of the environment, though this impacts the prices and has significant causality on the exchange rate.

Source: Author’s computation from Eviews 15
To achieve the objective of this study, first, we construct the aggregate sentiment index using principal component analysis to form a linear combination of six different market-oriented proxies. The study further used E-GARCH (1,1) to model the volatility of stock returns by using three explanatory variables such as sentiment index (primary variable), exchange rate, interest rate, and inflation rate (control variables). The results showed that, with or without the macroeconomic indicators as the control variables, the sentiment index has a negative and significant relationship with the stock return volatility. This contradicts the results of Nnoje et al. (2021) and Njogo and Mabinuori (2020). Although, neither of the two studies used E-GARCH for analysis. The former used the GARCH model, which stated that the predictor coefficient has to be non-negative, and the latter used the panel regression model, which does not capture market volatility. However, the results are consistent with results from Yoshinaga and Castro Junior (2012), Lemmon and Portniaguina (2006), Baker and Wurgler (2006), Miller (1977), and De Long et al. (1990), who all assert that investor sentiment exerts negative influences on the outcome of market return volatility.
Furthermore, the study depicted that exchange and inflation rates are significantly related to return volatility in Nigeria. In particular, with more exchange rates comes higher returns volatility, while more inflation rate comes with lesser returns volatility. On the other hand, interest rate has no significant association with stock returns volatility in Nigeria.
Moreover, the study found a negative leverage effect and high persistence of volatility in the market return. The asymmetric effect of positive sentiment on the stock return volatility is greater than the effect of negative sentiment. This is expected because, according to De Long et al. (1990), higher sentiment in noise traders increases the market price volatility. Accordingly, the study shows that the exchange rate fosters market volatility while the inflation rate diminishes it.
Conditional Volatility
Figure 3, through the conditional variance graph from the E-GARCH (1,1) model, shows the dynamism of the Nigerian stock market volatility with(out) the macroeconomic factors (exchange rate and inflation rate). The first graph (Figure 3a) shows a high persistence of market volatility which shows a zig-zag movement of high and low returns from 2007 until 2013 – 2015, where the volatility returns exponentially increased before dropping again. Regarding the second graph (Figure 3b), the low persistence of returns volatility is noted throughout, except within 2007 – 2009, where the persistence is very high. This means that the exchange rate, inflation rate, and interest rate have an influence on the effect size of noise traders on the volatility market. However, the effect does not affect the returns from the year 2007 – 2009, and this may be due to the economic shocks from the global financial crisis or some potential factors not considered in this study.
Conclusion, Research Implication, and Limitation
Conclusion
Over the past century, an important and prevalent topic in finance has been to look at the many factors that can impact stock returns. There have been sparse studies, especially in Nigeria, on the sentiment index-return volatility nexus, which this study comprehensively examined with data covering 2005 to 2020. The study used the exchange, inflation, and interest rates as control variables.
The study concludes that the investors' optimism or pessimism significantly impacts the volatility of the stock market returns. Thus, the market mood of investors or noise traders is one of the factors (including exchange and inflation rates) changing the volatility of the stock price trend. Therefore, the study confirms that the efficient market hypothesis is not enough to explain the Nigerian stock market behavior. As such, behavioural finance should be more focused on research to investigate volatility in market returns. An in-depth assessment of market mood will help investors and financial managers identify investment entry and exit points. As a result, investors can improve portfolio performance by including sentiment as a critical driver of stock market volatility in asset pricing models. The findings will also assist authorities in reducing stock market volatility and uncertainty to safeguard shareholders' capital and encourage younger shareholders. Therefore, future studies should seek to derive investor sentiments from existing high-frequency data by including comprehensive and updated investor sentiment components that characterize real-time information.
Research Implication
This study has implications for academia, policymakers or portfolio managers, investors, and the government. First, the academia in Nigeria should engage in further analysis of the real-market problems of the financial market rather than focusing on theories that may act as a guide only. Second, policymakers and regulators (SEC and NSE) should educate and inform investors about the adverse effects of psychological prejudice on investment and market performance. Furthermore, efforts should also be made to adequately control noise traders’ moods, while portfolio managers should consider building market strategies that periodically examine the biases in the investment sentiment.
Bibliography:
Abdi, H., & Williams, L. J. (2010). Principal component analysis. Wiley interdisciplinary reviews: computational statistics, 2(4), 433-459.
Ahmed, S., & Ullah, N. (2013). Investor sentiment and stock market dynamics: A case of Pakistan. Journal of Public Administration, Finance and Law, 4(4), 126-135.
Ángeles López-Cabarcos, M., M Pérez-Pico, A., & López Perez, M. L. (2020). Investor sentiment in the theoretical field of behavioural finance. Economic research-Ekonomska istraživanja, 33(1), 2101-2228.
Alajekwu, U. B., Obialor, M. C., & Okoro, C. O. (2017). Effect of Investor Sentiment on Future Returns in The Nigerian Stock Market. Annals of Spiru Haret University, Economic Series, 17(2), 103-126.
Anusakumar, S. V., Ali, R., & Wooi, H. C. (2017). The Effect of Investor Sentiment On Stock Returns: Insight from Emerging Asian Markets. Asian Academy of Management Journal of Accounting & Finance, 13(1).
Awalludin, S. A., Ulfah, S., & Soro, S. (2018). Modeling the stock price returns volatility using GARCH (1, 1) in some Indonesia stock prices. In Journal of Physics: Conference Series (Vol. 948, No. 1, p. 012068). IOP Publishing.
Baker, M., & Stein, J. (2004). Market liquidity as a sentiment indicator. Journal of Financial Markets, 7(3), 271-299.
Baker, M., & Wurgler, J. (2006). Investor sentiment and the cross‐section of stock returns. The journal of Finance, 61(4), 1645-1680.
Baker, M., & Wurgler, J. (2007). Investor sentiment in the stock market. Journal of economic perspectives, 21(2), 129-152.
Bentes, S. R., & Menezes, R. (2012, November). Entropy: A new measure of stock market volatility?. In Journal of Physics: Conference Series (Vol. 394, No. 1, p. 012033). IOP Publishing.
Bollerslev, T. (1986). Generalized autoregressive conditional heteroskedasticity. Journal of econometrics, 31(3), 307-327.
Brown, G. W., & Cliff, M. T. (2005). Investor sentiment and asset valuation. The Journal of Business, 78(2), 405-440.
Changsheng, H., & Yongfeng, W. (2012). Investor sentiment and assets valuation. Systems Engineering Procedia, 3, 166-171.
Chen, S. T., & Haga, K. Y. A. (2021). Using E-GARCH to analyze the impact of investor sentiment on stock returns near stock market crashes. Frontiers in Psychology, 12.
Chirila, V., & Chirila, C. (2015). Stock return, seasonality and asymmetric conditional volatility in steel & iron subsector. Metalurgija, 54(1), 251-253.
De Long, J. B., Shleifer, A., Summers, L. H., & Waldmann, R. J. (1990). Noise trader risk in financial markets. Journal of political Economy, 98(4), 703-738.
Dickey, D.A., & Fuller, W.A. (1981) Likelihood ratio statistics for autoregressive time-series with a unit-root. Econometrica 49:1057–107.
Egbeonu, O. C., & Isidore, I. I. (2016). Finametric analysis of Nigeria stock market and volatility of returns. International Journal of Accounting Research, 2(10).
Engle, R. F. (1982). Autoregressive conditional heteroscedasticity with estimates of the variance of United Kingdom inflation. Econometrica: Journal of the econometric society, 987-1007.
Fama, E. F. (1965). The behavior of stock-market prices. The journal of Business, 38(1), 34-105.
Gizelis, D., & Chowdhury, S. (2016). Investor sentiment and stock returns: Evidence from the Athens Stock Exchange.
Huang, C., Yang, X., Yang, X., & Sheng, H. (2014). An empirical study of the effect of investor sentiment on returns of different industries. Mathematical Problems in Engineering, 2014.
Ihejirika, P. O and Anyanwu G (2013) Characterization of Volatilities in the Nigerian Stock Exchange: Prospects for Options Trading International Institute for Science. Technology & Education Research Journal of Finance and Accounting, 4(16), 38-49.
Khan, M. A., & Ahmad, E. (2018). Measurement of investor sentiment and its bi-directional contemporaneous and lead–lag relationship with returns: Evidence from Pakistan. Sustainability, 11(1), 94.
Lemmon, M., & Portniaguina, E. (2006). Consumer confidence and asset prices: Some empirical evidence. The Review of Financial Studies, 19(4), 1499-1529.
Miller, E. M. (1977). Risk, uncertainty, and divergence of opinion. The Journal of finance, 32(4), 1151-1168.
Ndwiga, D., & Muriu, P. W. (2016). Stock returns and volatility in an emerging equity market. Evidence from Kenya. European Scientific Journal, 12(4), 79-98.
Nelson, D. B. (1991). Conditional heteroskedasticity in asset returns: A new approach. Econometrica: Journal of the econometric society, 347-370.
Newey, W. K., & West, K. D. (1986). A simple, positive semi-definite, heteroskedasticity and auto-correlation consistent covariance matrix.
Njogo, B. O., & Mabinuori, O. (2020). Investors’ Sentiment and Stock Trading in the Nigerian Capital Market. Editorial Board, 235.
Nnoje, A. I., Okonkwo, J. J., & Anachedo, C. K. (2021). Investors’ Sentiments, Market Dynamics and Stock Market Returns in Nigeria. Journal of Contemporary Issues in Accounting, 1(1), 56-73.
Novak, J., & Petr, D. (2011). CAPM Beta, Size, Book-to-Market, and Momentum in Realized Stock Returns. Finance a Uver: Czech Journal of Economics & Finance, 61(1).
Ogunmuyiwa, M. S. (2010). Investor’s sentiment, stock market liquidity and economic growth in Nigeria. Journal of Social Sciences, 23(1), 63-67.
Olasehinde–Williams, G. (2018). An Examination of the Relationship between Volatility and Expected Returns in the BRVM Stock Market. Marketing, 3(5).
Oprea, D. S., & Brad, L. (2014). Investor sentiment and stock returns: Evidence from Romania. International Journal of Academic Research in Accounting, Finance and Management Sciences, 4(2), 19-25.
Pandey, P., & Sehgal, S. (2019). Investor sentiment and its role in asset pricing: An empirical study for India. IIMB Management Review, 31(2), 127-144.
PH, H., & Rishad, A. (2020). An empirical examination of investor sentiment and stock market volatility: evidence from India. Financial Innovation, 6(1), 1-15.
Rashid, A., Fayyaz, M., & Karim, M. (2019). Investor sentiment, momentum, and stock returns: an examination for direct and indirect effects. Economic research-Ekonomska istraživanja, 32(1), 2638-2656.
Rupande, L., Muguto, H. T., & Muzindutsi, P. F. (2019). Investor sentiment and stock return volatility: Evidence from the Johannesburg Stock Exchange. Cogent Economics & Finance, 7(1), 1600233.
Schmitz, P., Glaser, M., & Weber, M. (2006). Individual investor sentiment and stock returns-what do we learn from warrant traders?. Rationalitätskonzepte, Entscheidungsverhalten und ökonomische Modellierung, 6.
Ur Rehman, M. (2013). Investor's Sentiments and Stock Market Volatility: an empirical evidence from emerging stock market. Pakistan Journal of Commerce and Social Sciences (PJCSS), 7(1), 80-90
Uygur, U., & Taş, O. (2014). The impacts of investor sentiment on different economic sectors: Evidence from Istanbul Stock Exchange. Borsa Istanbul Review, 14(4), 236-241.
Ward, M., & Muller, C. (2012). Empirical testing of the CAPM on the JSE. Investment Analysts Journal, 41(76), 1-12.
West, K. D. (1987). A specification test for speculative bubbles. The Quarterly Journal of Economics, 102(3), 553-580.
Yoshinaga, C. E., & Castro Junior, F. H. F. D. (2012). The relationship between market sentiment index and stock rates of return: A panel data analysis. BAR-Brazilian Administration Review, 9(2), 189-210.
Author: Tunde Folorunso Ayinuola, student LIGS University
Co-Author: Kehinde Adekunle Adetiloye
Approved by: Dr. Babandi Ibrahim Gumel, lecturer LIGS University